What Matters For Running Backs In Fantasy Football: Scheme Edges, Team Performance & More
Dwain McFarland dives deep into the data to highlight what fantasy managers should be paying the most attention to when target league-winning running backs in their 2026 drafts.
We continue our series on what matters for each fantasy position. Last week, we covered QBs, and this week we turn our attention to RBs.
In this article, we’ll dive into the data points that have historically mattered the most (or not mattered) when projecting future fantasy success at the RB position in season-long leagues.
We’ll answer the following questions:
- What stats matter most?
- What types of backs are most likely to hold onto their workload?
- How important is efficiency?
- What do the different RB archetypes look like, and which profiles have produced elite seasons?
- When do RBs peak and begin to decline?
- How have rookies performed relative to ADP?
- Do rookie RBs improve as the season progresses?
- Should we draft RBs from bad teams?
- Which run concepts actually make a schematic difference in fantasy?
Ultimately, the goal is to identify what league-winning RBs look like. Much of that comes down to identifying the right types of players who can help us win in 2026.
These criteria will also serve as the foundation for my RB tiers article, where I’ll apply the same framework to the 2026 player pool.

Join Our Newsletter
Trusted by 400,000+ fantasy football players. Get access to Fantasy Life's free award winning newsletter and tools, all in one step.
By registering or logging in, you agree to our Terms of Use and Privacy Policy.
Which Stats Matter Most For RBs in Fantasy Football?
If you were stranded on a deserted island and could use only one data point for a fantasy draft, it would be previous-season points per game (PPG). It’s the most predictive stat in fantasy football across all positions. If you get one more data set, make it volume. For RBs, snaps lead to opportunities, and opportunities lead to fantasy points. Unlike WRs and TEs, just getting on the field gives RBs a path to production.
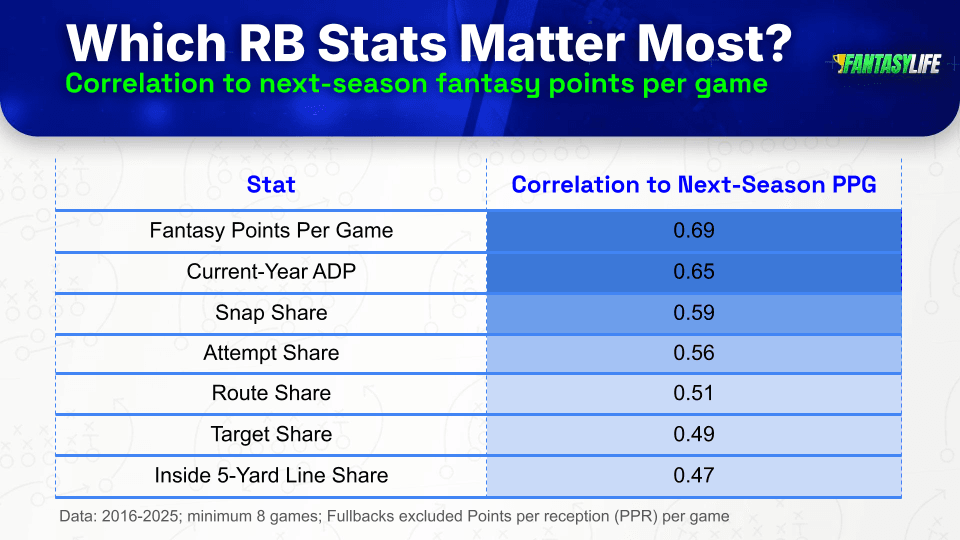
I included current-year fantasy football ADP as a comparison point. It finishing below the previous season's PPG feels a little counterintuitive given all the extra information the market has at its disposal (team changes, injuries, depth-chart battles, etc.).
Note:JJ Zachariason noted that he got different results using different data. JJ has been sharp on market-based analysis for years, so I’m not going to overreact to this correlation. Still, I’ll dig into the source he used next year.
I left yards and touchdowns out because they’re already part of fantasy points. Instead, I focused on the opportunity metrics that drive them: snaps, rushing attempts and receiving usage.
One way to simplify the table above is to use RB rushing PPG and receiving PPG.
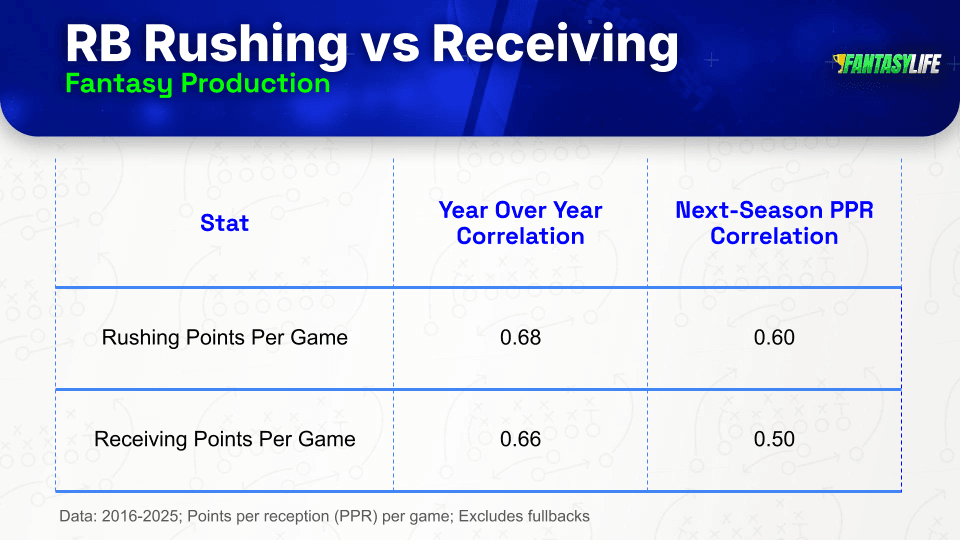
Rushing and receiving production are similarly stable year over year, but rushing PPG gets a slight edge when it comes to predicting next-season PPG.
RBs are tricky because coaches love carving backfields into roles, and it usually takes a special kind of back to keep a large snap share from one year to the next.
From 2015 to 2024, 145 RBs reached a 60% snap share or higher. After removing 17 who didn’t play at least 8 games the following season because of injury or retirement, 72 repeated the feat. That means 72 of 128 eligible backs (56%) did it again.
To get more context on the repeaters versus the fallers, I split the players into two groups. Is there anything in the data that helps us spot the backs more likely to keep on keeping on rather than fade the following season?
- Group A: Reached 60%+ snaps again the following season
- Group B: Fell below 50% snaps the following season
Here is the data for each group from the baseline season, where all players were at 60%+ snaps:
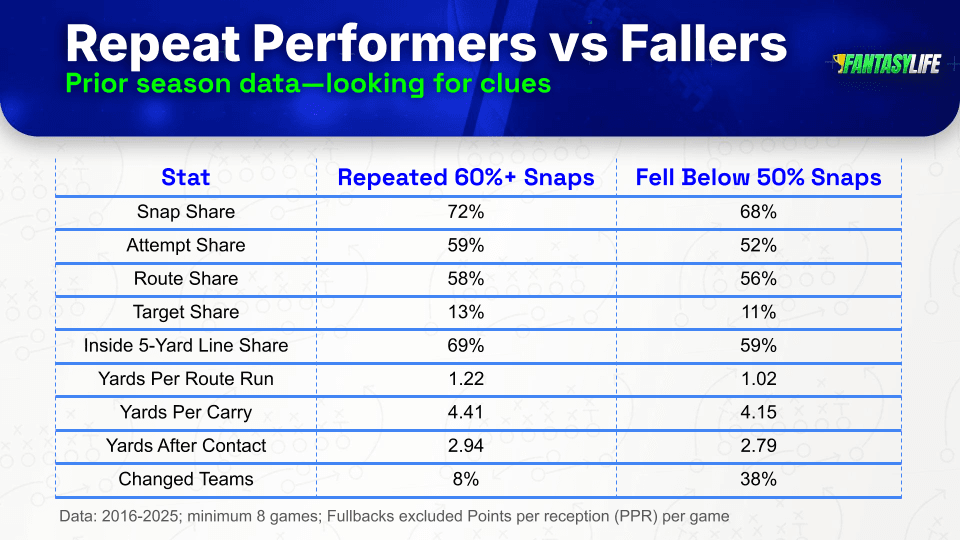
A few things stand out:
- The repeaters had slightly higher volume baselines.
- The repeaters were more efficient than the fallers.
- A little over a third of the fallers changed teams.
- I also looked at experience, but both were in the Year 4 bucket on average.
The efficiency stuff is interesting because, in a vacuum, it isn’t very predictive of future fantasy success or additional volume. But through this lens, it might be the thing helping certain players hang onto larger roles. And, of course, there are other variables at play, like new teammates from the NFL Draft or free agency, or a backfield mate returning from injury.
Speaking of efficiency …
Yards after contact and missed tackles forced are the two stickiest stats year over year, since RBs at least partially own them. But their correlation to next-season fantasy points is the lowest. In other words, the less stable data points actually correlate more strongly with next year’s PPG.
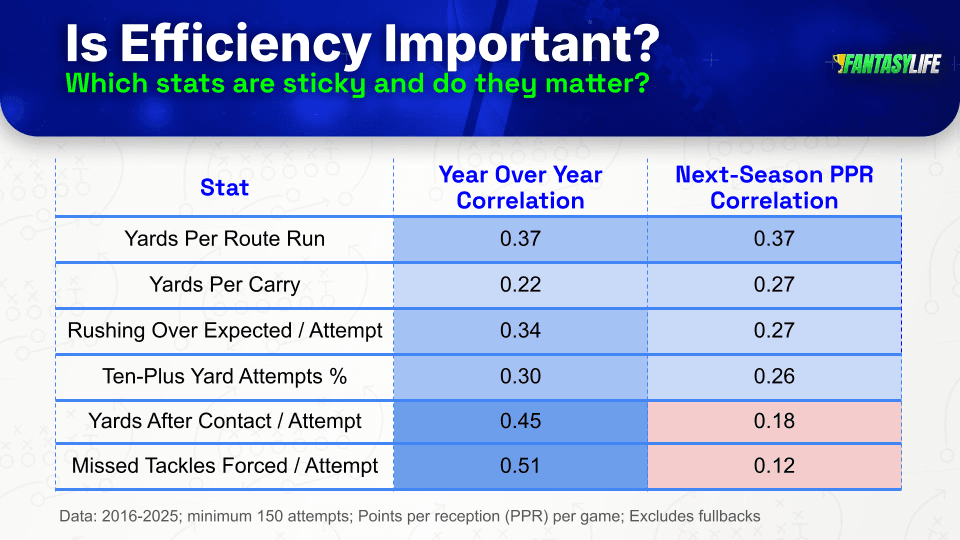
Efficiency is a great tie-breaker because, while it isn’t a huge component in isolation, it often shows up in league-winning seasons. The best RB seasons usually bring the 1-2 punch of volume and efficiency. And for some backs, that efficiency is more consistent. Think Jahmyr Gibbs, who has averaged 5+ yards per attempt all three seasons, or Jamaal Charles, who did the same. Explosive rush attempts do the best job of straddling stickiness and next-season success.
Still, historical data suggests a couple of key things to remember about efficiency:
- Small-sample efficiency doesn't always translate to larger workloads.
- Small-sample efficiency doesn't mean a back will get more work the following year.
- Higher-efficiency players coming off large-workload seasons do have an edge in holding onto their jobs—especially if the team is heavily invested.
What Do League-Winning RBs Look Like In Fantasy Football?
The easiest way to start this conversation is by setting the bar for excellence. The table below shows the volume and efficiency traits tied to different fantasy RB finishes, and the top row is the one we care about most: elite RBs who finished in the top three.
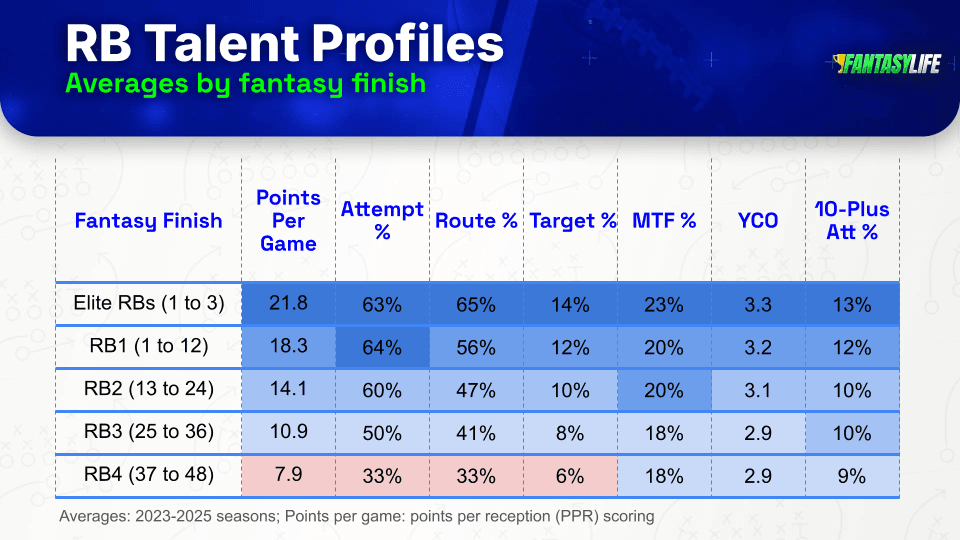
Top-three performers averaged 21.8 PPG over the last three seasons. Historically, RBs who score 20 PPG have added 2-3 WAR (wins above replacement) to fantasy teams and appeared on 62% of ESPN playoff rosters dating back to 2016. Only 6 of 34 failed to reach the 45% threshold, and those five of those missed games.
Note: I shortened the sample to 2023-2025 for two reasons:
- NFL passing is trending down over the last three years, which flows to RBs, especially in the passing game.
- League-wide RB target shares over the last two seasons (17.3% and 17.8%) are at their lowest since 2012, which affects how we should view target-share thresholds.

Normally, I don’t like changing sample-size references, but given the data, it felt appropriate to account for recent trends.
So, what do the players who can single-handedly help win your league have in common?
To answer that, let’s break backs into archetypes. These aren’t perfect cut points, but they work for the purpose of this exercise:
- Receiving: 50% or more of fantasy points came from receiving
- Dual: 40-59% of fantasy points came from receiving
- Balanced: 30-39% of fantasy points came from receiving
- Rushing: Less than 30% of points came from receiving
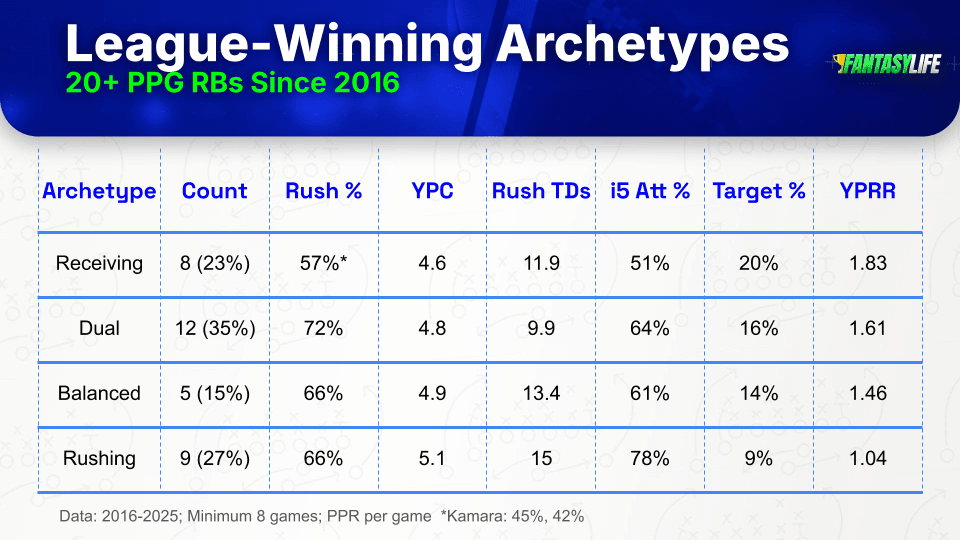
Takeaways and additional context:
- Receiving and dual-threat backs make up 58% of the league winners since 2016.
- Receiving backs are less dependent on high-end rushing efficiency and TD spikes because of their target share.
- Receiving backs had an average depth of target (aDOT) of 1.1 yards; they can do more than catch swing passes.
- Dual-threat backs had the highest rush share of the group, which may reflect staying on the field in all situations.
- Dual-threat backs were also the most likely to overcome an average team record, with an average of 9.5 wins and four teams at eight wins or fewer.
- Balanced backs must offset a loss in receiving work with more rushing TDs.
- Ultimately, we want backs with at least a chance of earning the 14% target share.
- Rushing backs need big-time efficiency and rushing TDs to offset the lack of passing-game work.
- Only two rushing archetype backs played on losing teams: Dalvin Cook in 2020 (7 wins) and Jonathan Taylor in 2025 (8 wins), though Taylor boomed early when the team was winning.
- We shouldn't be targeting early-down rushing archetypes on bad teams.
Who makes up each archetype cohort?
- Receiving: Christian McCaffrey (4), Alvin Kamara (2), Austin Ekeler (2)
- Dual-threat: Le'Veon Bell (2), Bijan Robinson (1), David Johnson (1), De'Von Achane (1), Ezekiel Elliott (1), Jahmyr Gibbs (1), James Conner (1), Kareem Hunt (1), Melvin Gordon (1), Saquon Barkley (1), Todd Gurley (1)
- Balanced: Christian McCaffrey (1), Dalvin Cook (1), Ezekiel Elliott (1), Jahmyr Gibbs (1), Todd Gurley (1)
- Rushing: Derrick Henry (3), Jonathan Taylor (2), Dalvin Cook (1), Ezekiel Elliott (1), Kyren Williams (1), Saquon Barkley (1)
While we used 20+ PPG players as the bar for league winners, there’s still a lot of value in finding 16-18+ PPG options, especially as the draft goes on. When you find a player between picks 37 and 72 who averages 17-19 PPG, you’re getting somewhere between 5.0 and 8.5 PPG over expected versus ADP, depending on where you took them in that range.
Here are some recent examples:
- Alvin Kamara | 2023 | Pick 62: 17.5 PPG vs. 12.6 expected PPG (+4.9) → +1.8 WAR
- Breece Hall | 2023 | Pick 40: 17 PPG vs. 14.2 expected PPG (+2.8) → +1.7 WAR
Kamara and Hall both offered the receiving profile we want to lean into. But I included Kamara because his discount came due to age. He was 28 that season. That begs the question: when does age matter for RBs in fantasy football?
How Much Does Age Matter For RBs In Fantasy Football?
RBs build into their best years early. They peak at ages 23-25, stay highly productive at 26-27, and then start to fade. At ages 28-30, they’re still producing at levels similar to their early seasons before a steeper drop hits at 31 and beyond.
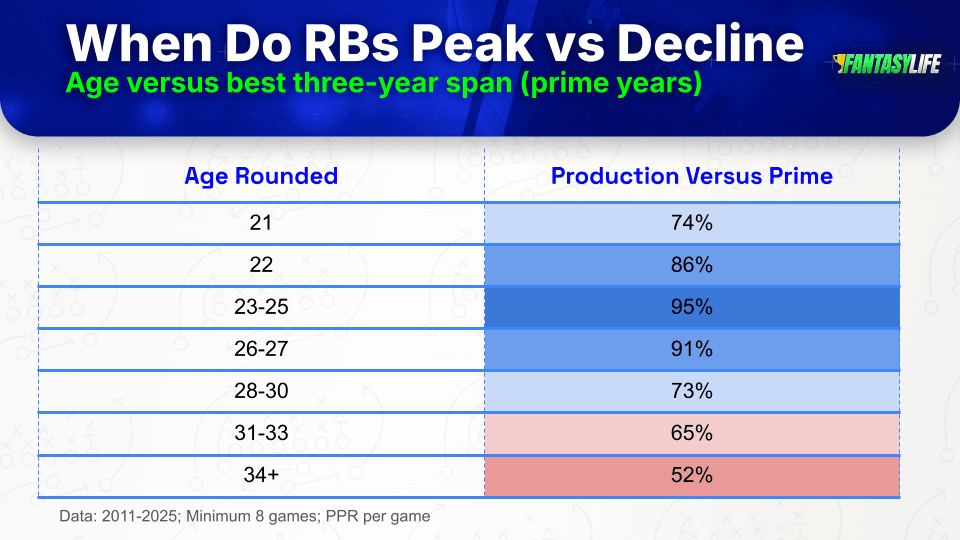
A couple of things matter here. This is a pooled view of all RBs, so the decline is relative to each player’s peak. That means high-end backs like Derrick Henry can still matter later in their careers because their down years are still stronger than what many backs ever reach. Survivorship bias is also in play, since most RBs are out of the league by age 31, which keeps the sample small.
To add more context, I went back to our league-winner data and expanded it to 18+ PPG seasons. That gives us a sample of 54 RBs.
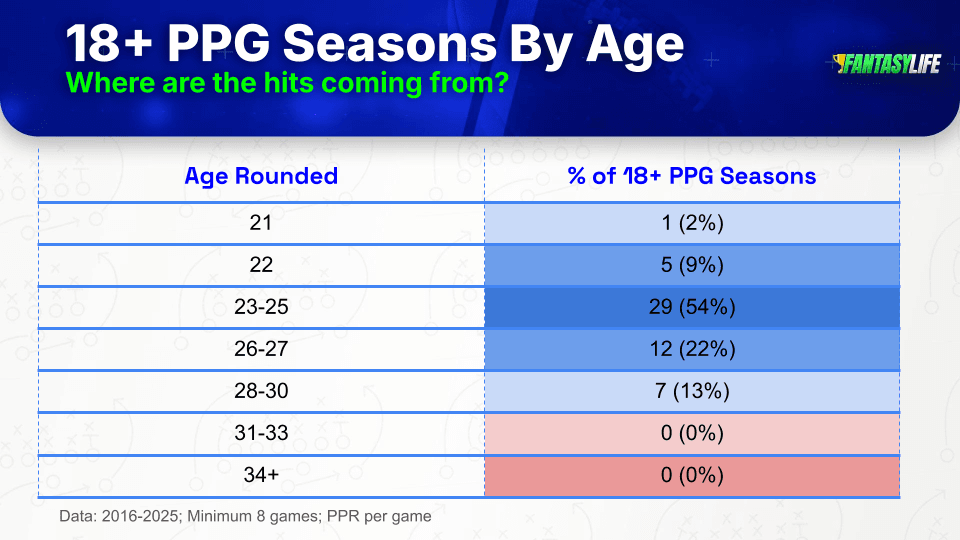
The shape of the data aligns well with the first table. Most of the 18+ PPG seasons came from the 23-25 bucket, with 26-27 next. Interestingly, if we combine the 21-22 bucket, which is mostly rookies, we get 11%, almost the same as the 28-30 range at 13%. In other words, we should be open to the right 28-30-year-old backs in a similar way to rookies.
These are just guidelines, and players will break the mold. Henry was still a strong fantasy asset last season at 16.8 PPG. I don’t know that he’ll break 18 this season, but I also don’t think we should project a massive falloff.
Rookie running backs have been a mixed bag. Here are the backs who were top-24 fantasy picks since 2016, along with their PPG over expected based on ADP:
Half outperformed ADP:
- Saquon Barkley (pick 7): +7.8 PPG
- Ezekiel Elliott (10): +2.5
- Najee Harris (16): +1.5
- Ashton Jeanty (11): -1.7
- Clyde Edwards-Helaire (14): -2.7
- Bijan Robinson (8): -4.5
If we expand rookie picks to rounds 3 to 6 of fantasy drafts (picks 37 to 72), 12 of 19 (63%) surpassed their ADP PPG expectations.
- Kareem Hunt (pick 38): +6.0
- Todd Gurley (63): +5.0
- Jonathan Taylor (43): +4.4
- D'Andre Swift (66): +3.7
- Jahmyr Gibbs (33): +2.1
- TJ Yeldon (56): +1.8
- Leonard Fournette (25): +1.5
- RJ Harvey (61): +1.1
- Javonte Williams (61): +1.0
- Omarion Hampton (36): +0.9
- Josh Jacobs (34): +0.7
- Christian McCaffrey (27): +0.2
- David Montgomery (45): -0.3
- TreVeyon Henderson (45): -0.4
- Joe Mixon (44): -2.2
- Cam Akers (55): -3.2
- Ameer Abdullah (49): -5.0
- Royce Freeman (41): -5.2
- Melvin Gordon III (37): -5.9
For the most part, the price of rookie RBs has held firm over the last 10 years when comparing 2016-2020 to 2021-2025.
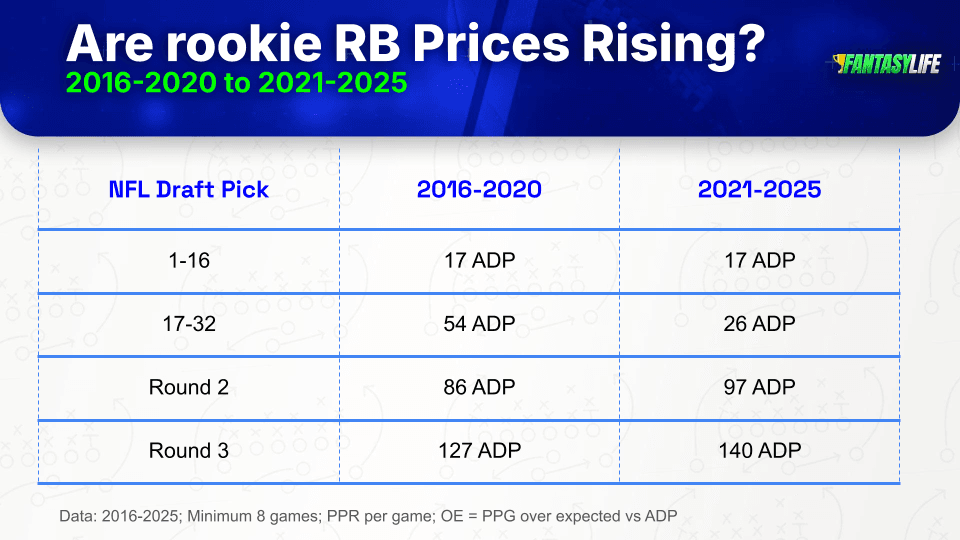
The only cohort that costs more is Round 1 picks from 17-32, which are twice as expensive. Even so, the market was generally sharp on that 2021-2025 group, with a +1.2 PPG over expected vs. ADP, although it was a small sample that included Omarion Hampton and Najee Harris.
We all want to draft rookies because they offer massive upside, but only four have paid that off by posting a WAR of 3 or higher: Barkley, Elliott, Hunt and Kamara. That doesn’t mean we shouldn’t draft rookie RBs—we should. It just means opportunity cost matters, and that comes back to the price tag.
For example, taking Jeremiyah Love over an older option like Henry, who delivered massive prime seasons, isn't something I am doing in 2026. The prime-age data is similar for both, but Henry has proven it, and because his peak was so high, he still has room to make a significant contribution to our fantasy lineup.
Do Rookie RBs Provide Late-Season Fantasy Upside?
In fantasy, we want players peaking when it matters most: the playoff push and the fantasy postseason. For RBs, every draft-round cohort has shown a snap-share boost from Weeks 13-17.

Round 1 rookies were down 6% in fantasy PPG during that stretch, but the 4% snap increase matters. Round 1 picks often carry bigger roles early, and injuries and fatigue can take a toll.
The biggest takeaway is the jump we see from Day 2 NFL Draft picks and Rounds 4-5 players. That group increased PPG by 19% and snaps by 14%. By then, some teams are shifting toward next year’s evaluation, while veterans are dealing with injuries or getting shut down.
There is some interesting context to this equation: the experience of the other RBs on the roster. We also see an uptick or neutral playing time for Year 2 to Year 3 RBs late in the season. However, veterans often see their playing time fade.
Weeks 13 to 17 Snap Share Change by RB Experience:
- Year 2 to 3: +1%
- Year 4 to 5: +0%
- Year 6 to 7: -6%
- Year 8 to 9: -5%
- Year 10+: -11%
It isn’t a perfect science, but the macro edge is clear: rookie RBs—and even early-career backs—can pay off late in the season—especially when they’re behind aging veterans who didn’t peak in a big way.
We’ve seen it with Bucky Irving (17 PPG), Javonte Williams (15.1) and Tyler Allgeier (14.5).
Of course, in managed leagues, many of the rookies will be dropped after a slow start. Backs in these situations are good waiver wire or trade targets.
Should We Draft RBs On Bad NFL Teams In Fantasy?
If you are seeking league-crushing 20+ PPG upside, the short answer is yes: we should avoid terrible NFL teams. But really, this is an exercise about extremes. The edge cases matter, but the teams in the middle are fairly similar in RB hit rates.
For this exercise, I have stratified teams into five buckets to evaluate elite RB1 (20+ PPG), low-to-mid RB1s (16-19.9 PPG), and mid-to-high RB2s (14.5-15.9 PPG).
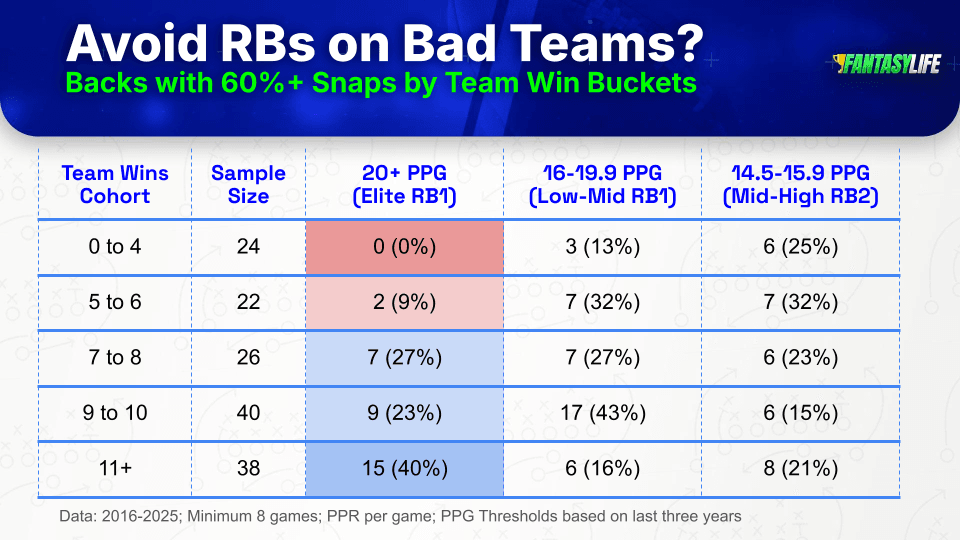
For league-winning production, the highest hit rate has come from teams that won 11+ games since 2016 (40%). On the flip side, teams in the 0-4 (0%) and 5-6 (9%) win cohorts struggled to produce elite RB1s. There were two exceptions—and they were massive hits:
- Christian McCaffrey | Panthers (2019): 5 Wins → 29.5 PPG (93% snaps, 24% target share)
- Saquon Barkley | Giants (2018): 5 Wins → 24.1 PPG (83% snaps, 21% target share)
Both players were able to offset their team's environment with talent, massive snaps and strong involvement in the passing game. That helped negate a bad supporting cast and trailing game scripts.
***Jeremiyah Love enthusiasts say it in unison: So you're telling me there's a chance!***
While the league-smashing hits were rare from the two lowest win-total buckets, we did see 10 backs find their way into the 16-19.9 PPG range. The 5-6 win bucket was on par with higher-win-total teams with a 32% hit rate.
0-4 Win 16-19.9 PPG Performers:
- Saquon Barkley | Giants (2019): 4 Wins → 18.8 PPG (84% snaps)
- James Robinson | Jaguars (2020): 1 Win → 17.9 PPG (70% snaps)
- D'Andre Swift | Lions (2021): 3 Wins → 16.1 PPG (60% snaps, 14% targets)
5-6 Win 16-19.9 PPG Performers:
- Josh Jacobs | Raiders: 6 Wins → 19.3 PPG (75% snaps)
- Melvin Gordon III | Chargers: 5 Wins → 19.3 PPG (75% snaps)
- Alvin Kamara | Saints: 5 Wins → 19 PPG (71% snaps, 17% targets)
- Joe Mixon | Bengals: 6 Wins → 17.4 PPG (70% snaps)
- Leonard Fournette | Jaguars → 17.3 PPG (88% snaps, 18% targets)
- Chase Brown | Bengals → 16.6 PPG (66% snaps, 15% targets)
- Chuba Hubbard | Panthers → 16.1 PPG (77% snaps)
The majority of these backs, aside from Brown and Hubbard, had strong draft capital and/or a proven track record. They succeeded thanks to massive workloads, which isn't the easiest thing to predict (but we were in on Brown that season, y'all!).
Are There Any Scheme Edges For RBs In Fantasy?
I went way deep on scheme stuff for RBs about four years ago and, honestly, didn't find anything I felt was sticky or predictive enough to weigh much in my player analysis. However, I wanted to revisit the topic.
And really, my stance hasn't changed much. These things fluctuate, and there are massive variables at play: coaches sticking with the same run schemes, the RB fit within schemes, fit with the offensive linemen, offensive line quality and offensive line injuries.
But that doesn't mean that I don't think it matters. I think it certainly matters. It is just that it is hard to predict how it will all play out. Having said all of that, I do have a couple of juicy nuggets for you.
First, there are some run concepts over the last five years in the league that have provided better results than others. For this research, I only used data on plays between the 20s, since team and defensive behaviors change much closer to the goal lines. Also, I wanted to use fantasy points per attempt as an easy way to quantify results, and TDs play too much of a role inside the five-yard line.
But before we dive into those, we need to set a baseline. The best way to do that is to look at the two run concepts that are used the most often in the NFL:
- Outside Zone: 14,351 attempts; 0.48 fantasy points per rush; 4.5 YPC, 10.9% explosive
- Inside Zone: 10,414 attempts; 0.47 fantasy points per rush; 4.4 YPC; 9.2% explosive
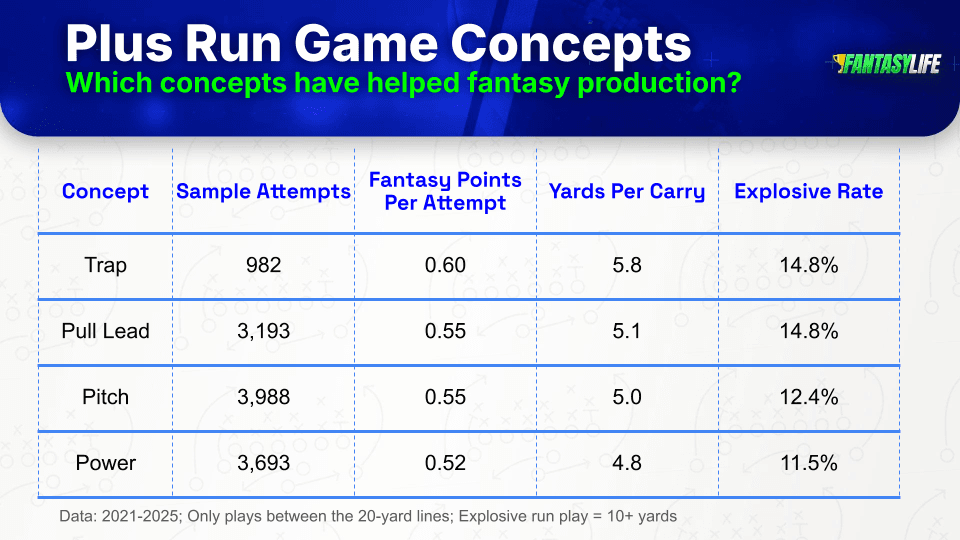
Part of the success of these plays may be tied to the element of surprise. They aren't used at the same rate as the staple concepts. Things defenses don't see as often can impact recognition time, and there could also be an edge in variety. The more things a defense has to prepare for, the less likely they are to be equipped to take everything away.
Second, we have a group of playcallers who have utilized these concepts more than the rest, which could give their run games an edge in 2026.
2025 Play Callers Who Utilized Plus Run Concepts Often:
- Drew Petzing | Lions (35% plus concepts): Petzing isn't viewed as a great offensive mind, but his concepts could boom with a better offense in Detroit. (#12 consensus o-line rank)
- Shane Steichen | Colts (27%): Steichen finally got competent QB play last season, and Jonathan Taylor averaged 6.1 YPC on 103 attempts using these concepts. (#9 consensus o-line)
- Greg Roman | Giants (25%): Matt Nagy is officially the OC in New York, but the senior offensive assistant could help Nagy get this run game on track. And the Giants made the offensive additions that align with bully ball. (#20 consensus o-line)
- Mike McDaniel | Chargers (24%): McDaniel knows how to maximize the run game, and Omarion Hampton averaged 5.0 YPC on plus concepts as a rookie. (#10 consensus o-line)
- Sean Payton | Broncos (24%): Technically, Davis Webb will call plays this year, but he has called it a Payton offense. J.K. Dobbins averaged 5.2 YPC with a 17.8% explosive rate on plus concepts in 2025. RJ Harvey averaged 4.7 and 8.5%. (#1 consensus o-line)
- Klint Kubiak | Raiders (21%): Kubiak energized the Seahawks' ground attack on a Super Bowl run last season. The team now gets back tackle Colton Miller and added superstar Tyler Linderbaum at center. Ashton Jeanty averaged only 2.7 YPC last year on plus concepts, but his average yards before contact was -0.10. (#25 consensus o-line)
- Kyle Shanahan | 49ers (20%): It's Kyle Shanahan. What else do I need to say? (#8 consensus o-line)
- Liam Coen | Jaguars (20%): Coen helped get the Bucs' run game going in 2024 with a breakout from Bucky Irving. Last year, Travis Etienne averaged 5.5 YPC on these concepts with an 18.5% explosive rate. Now Bhayshul Tuten gets a chance to take over. He averaged 5.2 YPC on 25 attempts in plus concepts with a 16% explosive rate. (#23 consensus o-line)
Join Our Newsletter
Trusted by 400,000+ fantasy football players. Get access to Fantasy Life's free award winning newsletter and tools, all in one step.
By registering or logging in, you agree to our Terms of Use and Privacy Policy.
Players Mentioned in this Article







Published Updated